Search Close Search
Search Close Search
Page Menu

Initial Career Outcomes for PhD Graduates

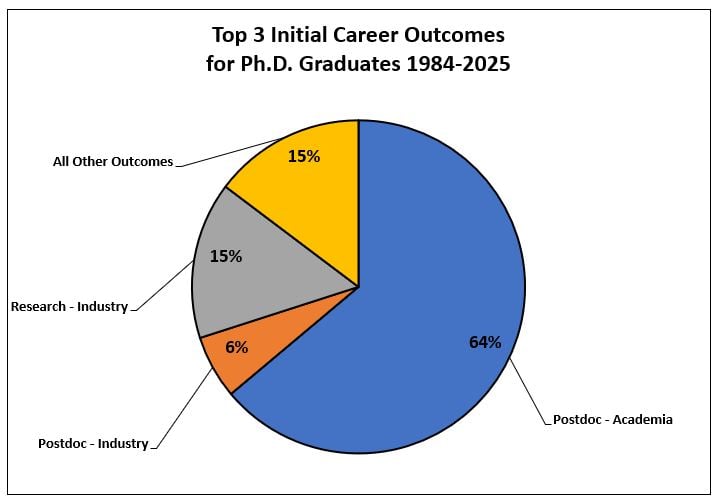
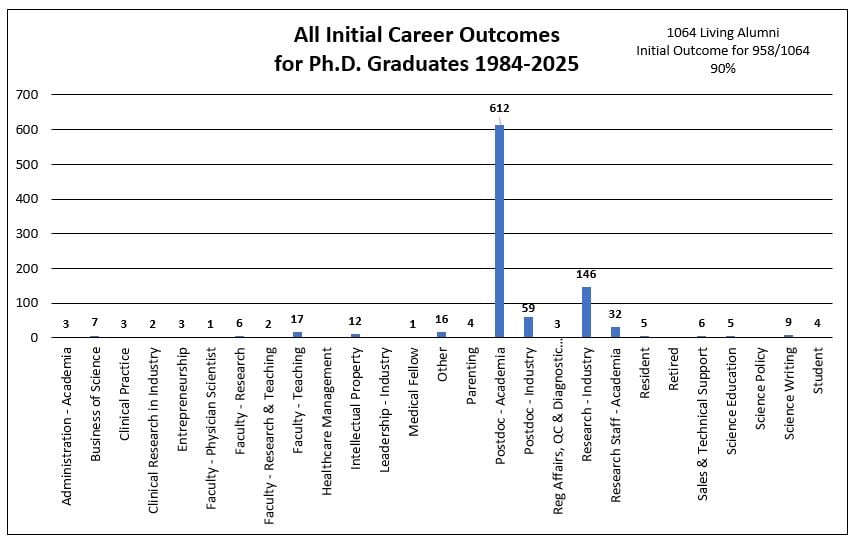
See images below for more information about initial career outcomes for PhD Graduates.

Pie chart titled ‘Top 3 Initial Career Outcomes for Ph.D. Graduates 1984–2025.’ The largest segment, 64%, represents Postdoc – Academia and is shown in blue. A 15% gray segment represents Research – Industry. Another 15% yellow segment represents All Other Outcomes. A 6% orange segment represents Postdoc – Industry.

Bar chart titled ‘All Initial Career Outcomes for Ph.D. Graduates 1984–2025.’ Multiple career categories are listed along the horizontal axis, each with a corresponding bar showing the number of graduates. The tallest bar is for Postdoc – Academia with 612 graduates. Other notable counts include Research – Industry with 146 and Postdoc – Industry with 59. All remaining categories range from 1 to about 32 graduates each. A note in the upper right states: ‘1064 Living Alumni; Initial Outcome for 958/1064 (90%).