Skip to main content
Skip to search
Skip to main menu
Skip to page specific menu
Skip to footer area
Site Menu
Search
Close Search
Search the Morningside Graduate School of Biomedical Sciences site
Search
A-Z
|
Search All UMass Chan Sites
Current Students
Postdocs
Faculty & Administration
Intranet/SharePoint
Search
Close Search
Search the Morningside Graduate School of Biomedical Sciences site
Search
A-Z
|
Search All UMass Chan Sites
Morningside Graduate School of Biomedical Sciences
About
About
Dean's Welcome
Leadership
Accreditation
Catalog
Diversity and Inclusion
Campus Safety
Contact Us
Academics
Academics
PhD Biomedical Sciences
PhD Biomedical Sciences
Biochemistry and Molecular Biotechnology
Biophysical, Chemical and Computational Biology Pathway
Cancer Biology
Immunology and Microbiology Program
Interdisciplinary Graduate Program
Millennium PhD
Neuroscience
Population Health Sciences
RNA Therapeutics and Biology
Systems, Computational, and Quantitative Biology
Translational Science
MD/PhD
Master of Science Clinical Investigation
Postbaccalaureate Research Education Program (PREP)
Outreach Programs
Courses
Credit Hour Policy
Admissions
Admissions
Admissions Requirements
Funding
Admissions FAQs
Technical Standards
Core Competencies
Connect with Us
Request Information
Apply
Student Community
Student Community
Overview
Student Demographics
Doctoral Degree Completion Data
Student Accomplishments
Student Accomplishments
Publications
External Awards for Research Training
Morningside Awards for Scholarship, Education, and Community Service
Morningside Awards for Scholarship, Education, and Community Service
Zelda Haidak Award Winners
Dan Mullen Award for Scientific Achievement Winners
Riccio Award Winners
Chancellor's Award Winners
Outstanding Thesis Research Award Winners
Outstanding Mid-Thesis Research Award Winners
Student Community Service Leadership Award Winners
Outstanding Student Mentor in the Classroom or Research Setting Award Winners
Class Speaker Award Winners
Student JEDI (Justice, Equity, Diversity, Inclusion) Leadership Award Winners
Student Organizations
Life in Worcester
Career & Professional Development
Career & Professional Development
Career Development Center
Career Outcomes
Career Outcomes
Initial Career Outcomes for PhD Graduates
Current Career Outcomes for Basic Biomedical Science PhD Graduates
Current Career Outcomes for Population Health Sciences PhD Graduates
Current Career Outcomes for MD/PhD Graduates
Current Career Outcomes for MSCI Graduates
Current Career Outcomes MS
Federally-Funded Training Programs
Initiative for Maximizing Student Development (IMSD)
Faculty & Research
Faculty & Research
Program and Pathway Directors
Faculty
Research Core Facilities
Additional Resources
Current Students
Postdocs
Faculty & Administration
Intranet/SharePoint
Page Menu
x
Student Community
Overview
Student Demographics
Doctoral Degree Completion Data
Student Accomplishments
Publications
External Awards for Research Training
Morningside Awards for Scholarship, Education, and Community Service
Zelda Haidak Award Winners
Dan Mullen Award for Scientific Achievement Winners
Riccio Award Winners
Chancellor's Award Winners
Outstanding Thesis Research Award Winners
Outstanding Mid-Thesis Research Award Winners
Student Community Service Leadership Award Winners
Outstanding Student Mentor in the Classroom or Research Setting Award Winners
Class Speaker Award Winners
Student JEDI (Justice, Equity, Diversity, Inclusion) Leadership Award Winners
Student Organizations
Life in Worcester
Morningside Graduate School of Biomedical Sciences
Student Community
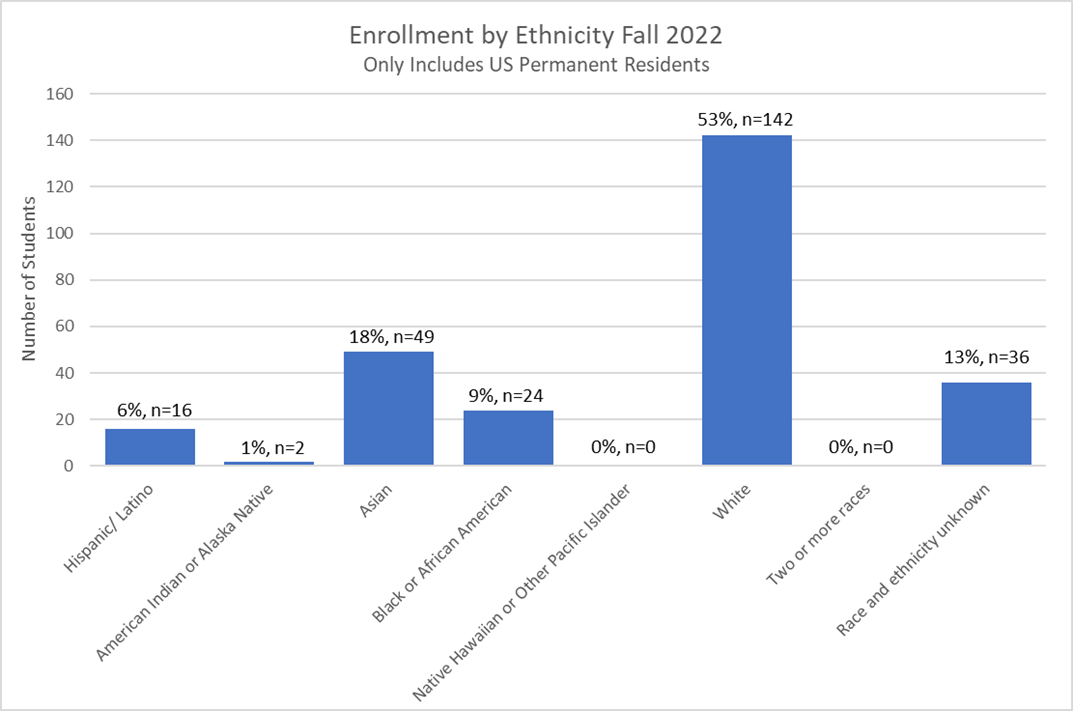
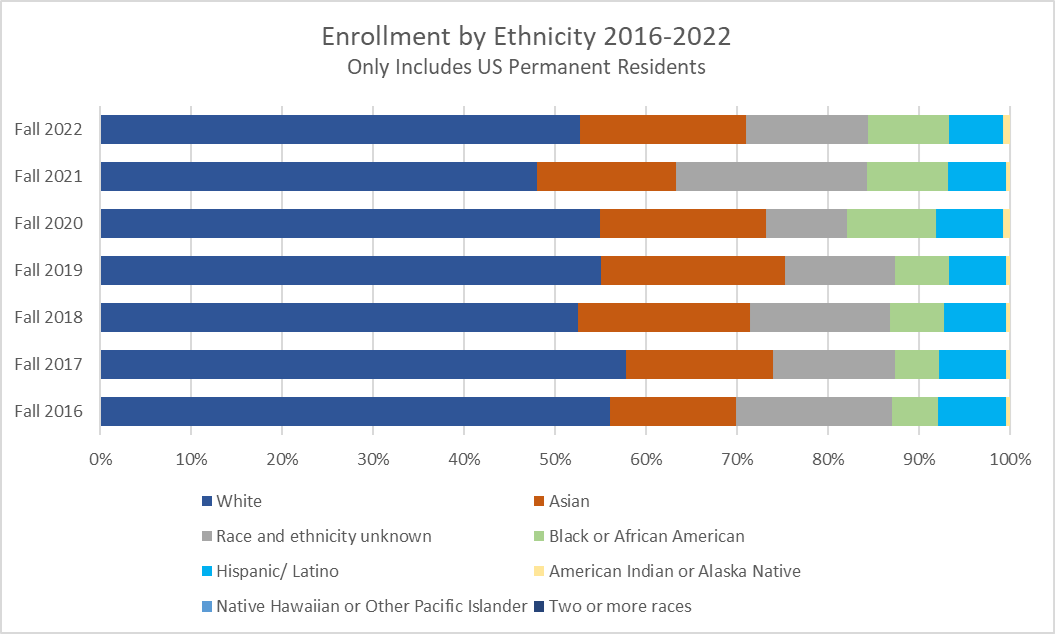
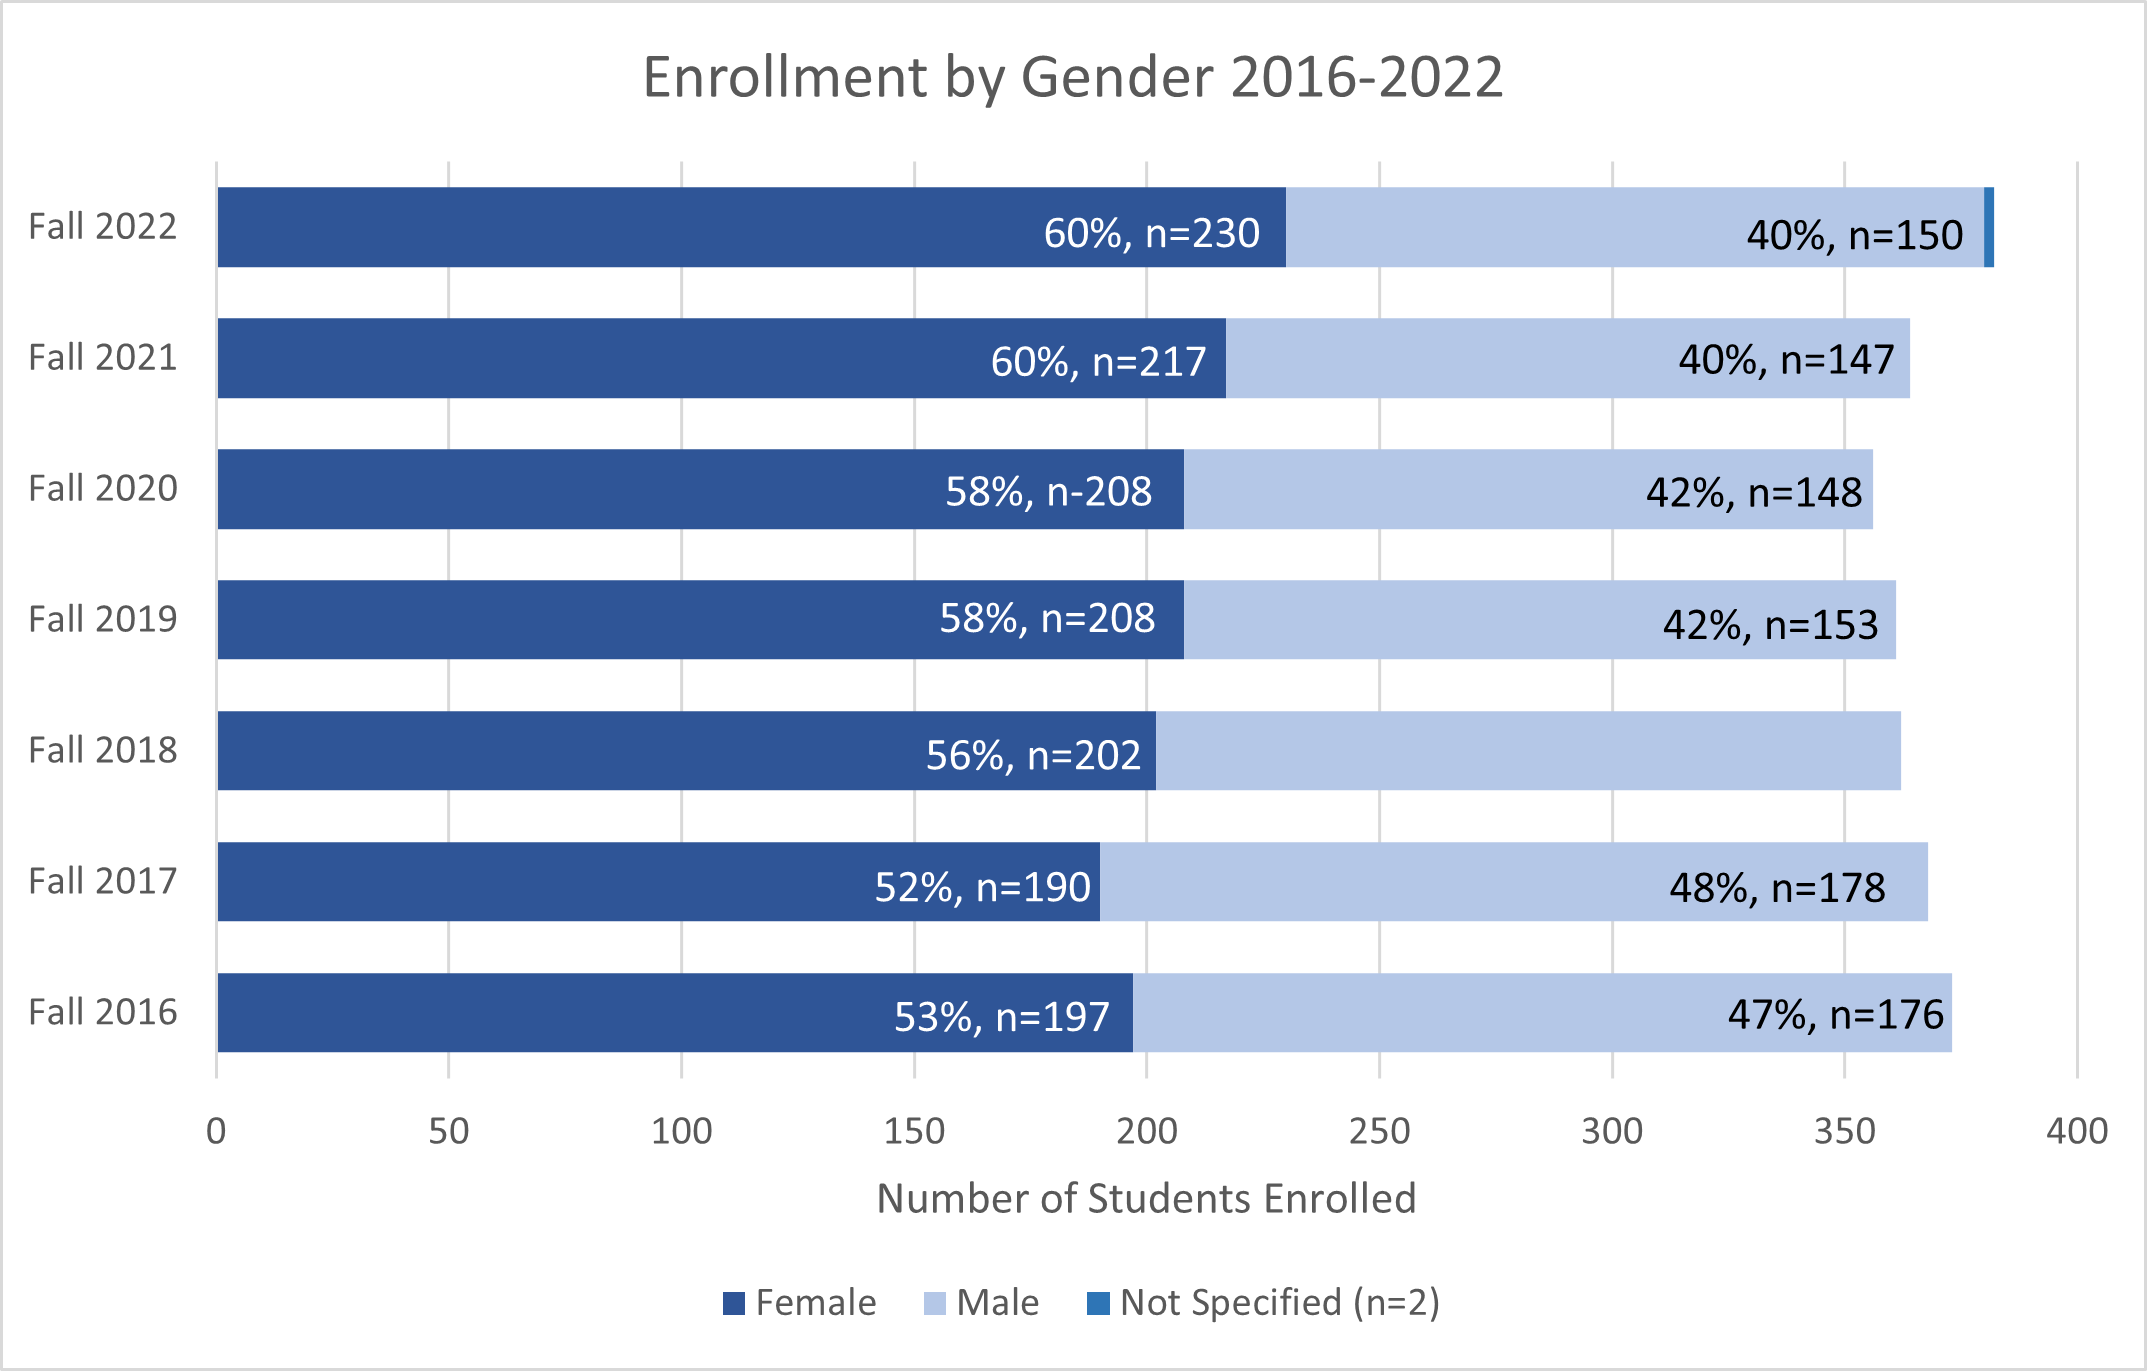
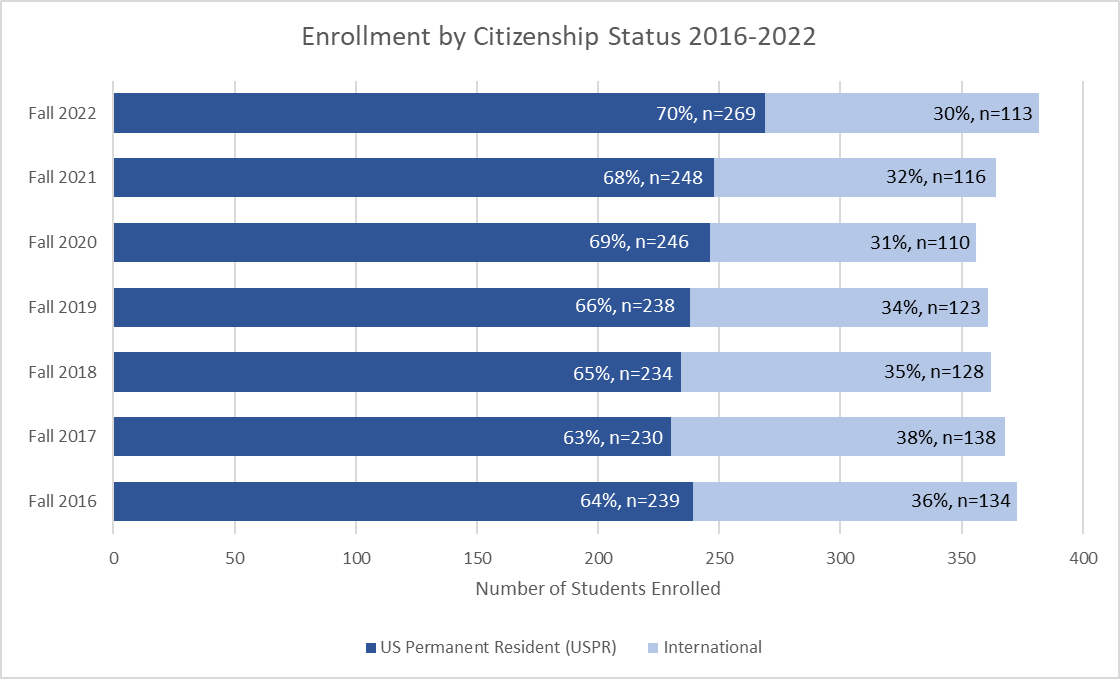
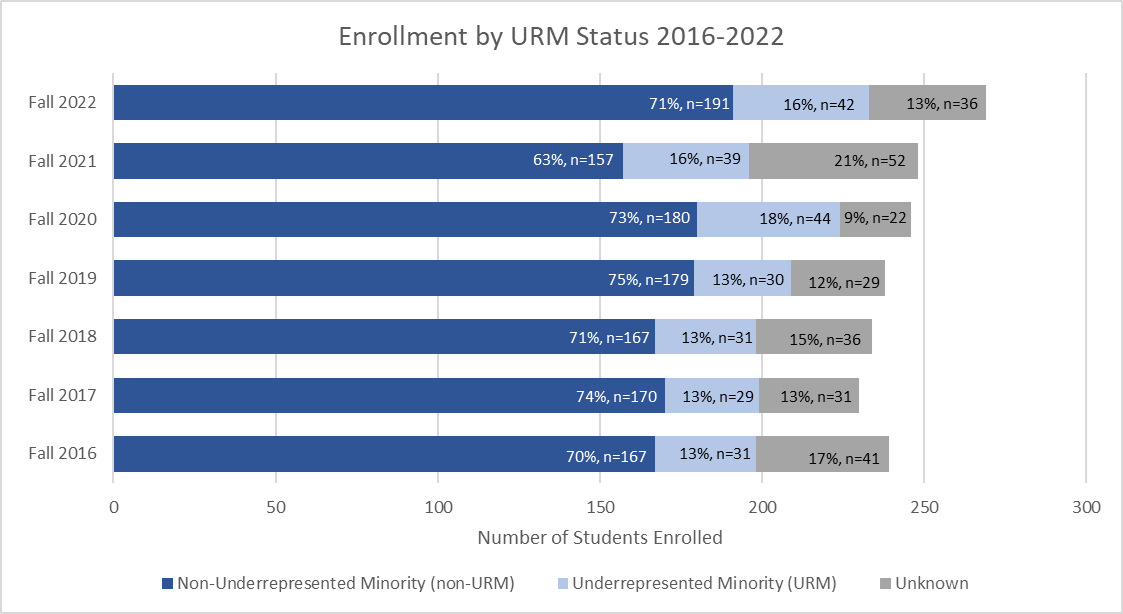
Student Demographics
Student Body Demographics of the Morningside Graduate School of Biomedical Sciences
Back To Top ▲
Close
About
About
Dean's Welcome
Leadership
Accreditation
Catalog
Diversity and Inclusion
Campus Safety
Contact Us
Academics
Academics
PhD Biomedical Sciences
PhD Biomedical Sciences
Biochemistry and Molecular Biotechnology
Biophysical, Chemical and Computational Biology Pathway
Cancer Biology
Immunology and Microbiology Program
Interdisciplinary Graduate Program
Millennium PhD
Neuroscience
Population Health Sciences
RNA Therapeutics and Biology
Systems, Computational, and Quantitative Biology
Translational Science
MD/PhD
Master of Science Clinical Investigation
Postbaccalaureate Research Education Program (PREP)
Outreach Programs
Courses
Credit Hour Policy
Admissions
Admissions
Admissions Requirements
Funding
Admissions FAQs
Technical Standards
Core Competencies
Connect with Us
Request Information
Apply
Student Community
Student Community
Overview
Student Demographics
Doctoral Degree Completion Data
Student Accomplishments
Student Accomplishments
Publications
External Awards for Research Training
Morningside Awards for Scholarship, Education, and Community Service
Morningside Awards for Scholarship, Education, and Community Service
Zelda Haidak Award Winners
Dan Mullen Award for Scientific Achievement Winners
Riccio Award Winners
Chancellor's Award Winners
Outstanding Thesis Research Award Winners
Outstanding Mid-Thesis Research Award Winners
Student Community Service Leadership Award Winners
Outstanding Student Mentor in the Classroom or Research Setting Award Winners
Class Speaker Award Winners
Student JEDI (Justice, Equity, Diversity, Inclusion) Leadership Award Winners
Student Organizations
Life in Worcester
Career & Professional Development
Career & Professional Development
Career Development Center
Career Outcomes
Career Outcomes
Initial Career Outcomes for PhD Graduates
Current Career Outcomes for Basic Biomedical Science PhD Graduates
Current Career Outcomes for Population Health Sciences PhD Graduates
Current Career Outcomes for MD/PhD Graduates
Current Career Outcomes for MSCI Graduates
Current Career Outcomes MS
Federally-Funded Training Programs
Initiative for Maximizing Student Development (IMSD)
Faculty & Research
Faculty & Research
Program and Pathway Directors
Faculty
Research Core Facilities
Additional Resources
Current Students
Postdocs
Faculty & Administration
Intranet/SharePoint