


Doctoral Degree Completion Data
Student Completion and Retention Rates and Average Time to Degree
We recognize that our mean and median time to degree is considered to be long, and we are taking active steps to ensure that Morningside Graduate School of Biomedical Sciences students complete an impactful body of work in timely manner. These steps include streamlining curricular requirements, monitoring timely completion of the qualifying exam, monitoring student scientific development and progress, and articulating clear standards for degree completion. Impacts of changes made over the last five years will be measured by tracking the six-year completion rate for each cohort.
Completion Rates
75% of matriculating students received a PhD terminal degree and an additional 4% received a Master of Science as a terminal degree. Completion rates were calculated for cohorts entering 2008-2012 and completing by 2020 (based on 150% average time to PhD = 9 years)
Retention Rates
The retention rate of first year students entering their second year of graduate study for the three most recent years is: Fall 2020 = 98%, Fall 2019 = 95%, Fall 2018 = 94%
Time to Degree
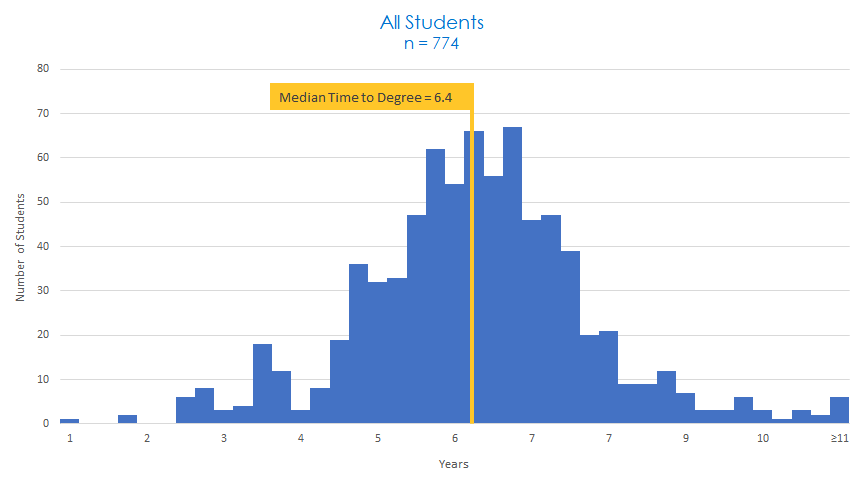
For the most recent 10-year period (2010-2020), the time to degree (TTD) for all PhD graduates from the Basic Biomedical Sciences (BBS) division of the Morningside Graduate School of Biomedical Sciences was 6.6 years.
Time to Degree
Median Time to Degree by 3-Year Graduating Class 2000-2020
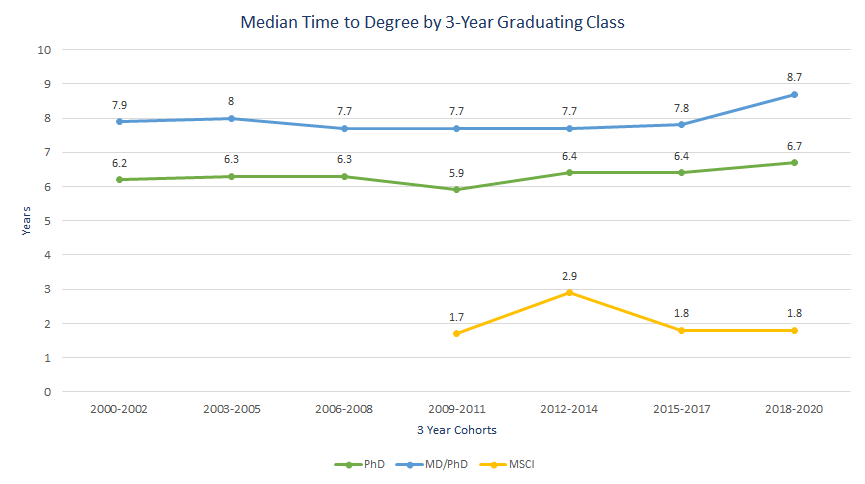
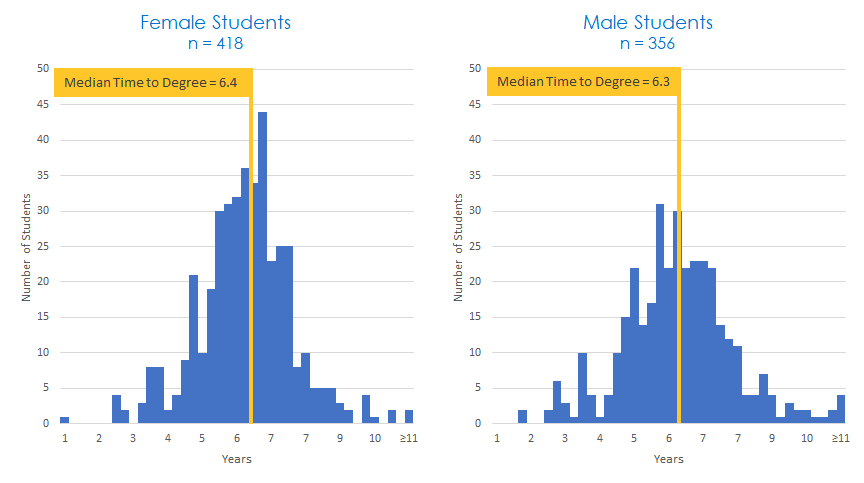
PhD Median Time to Degree 2000-2020
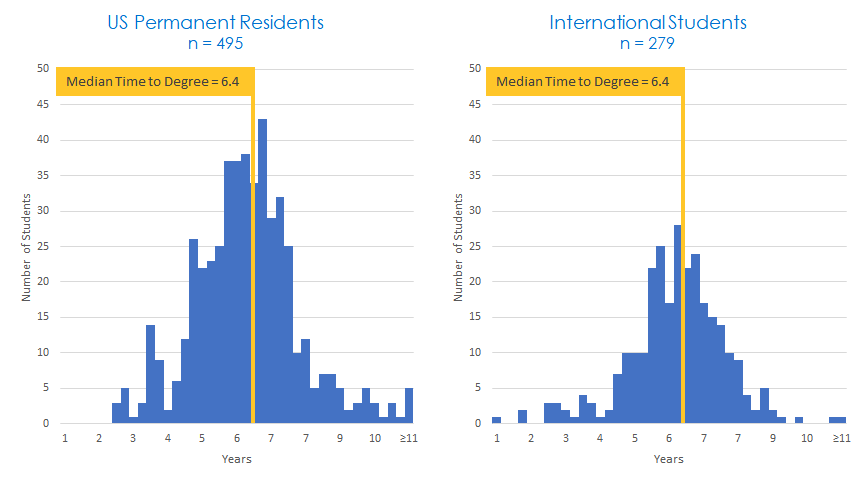
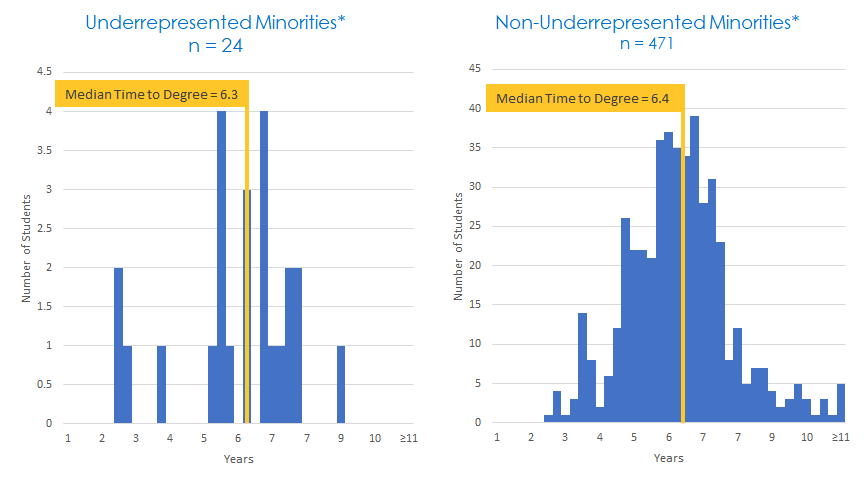
*International students are excluded from the URM data. US Citizens and Permanent Residents only.
MD/PhD Median Time to Degree 2000-2020
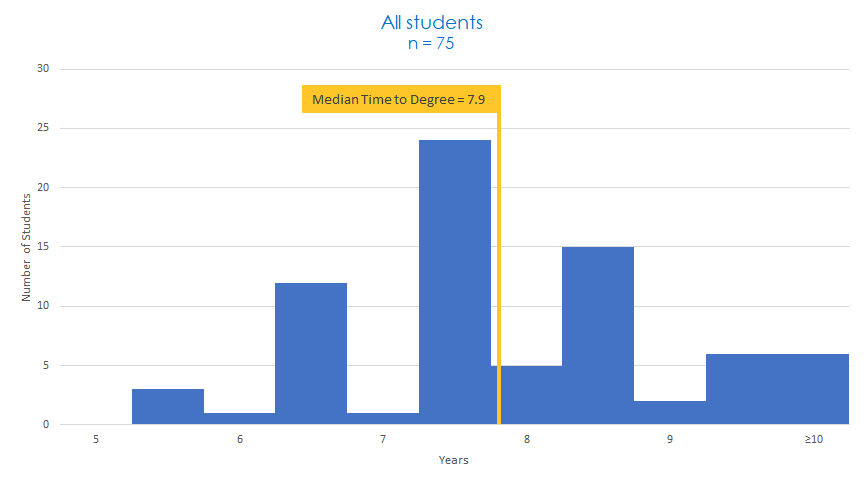
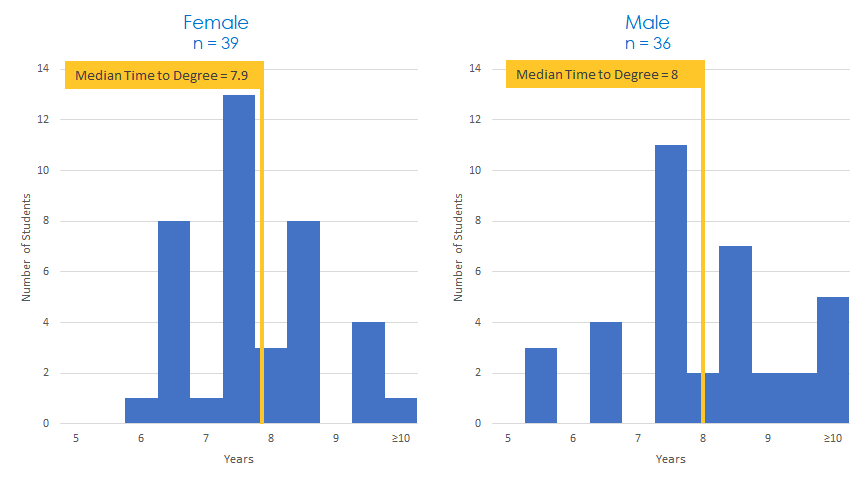
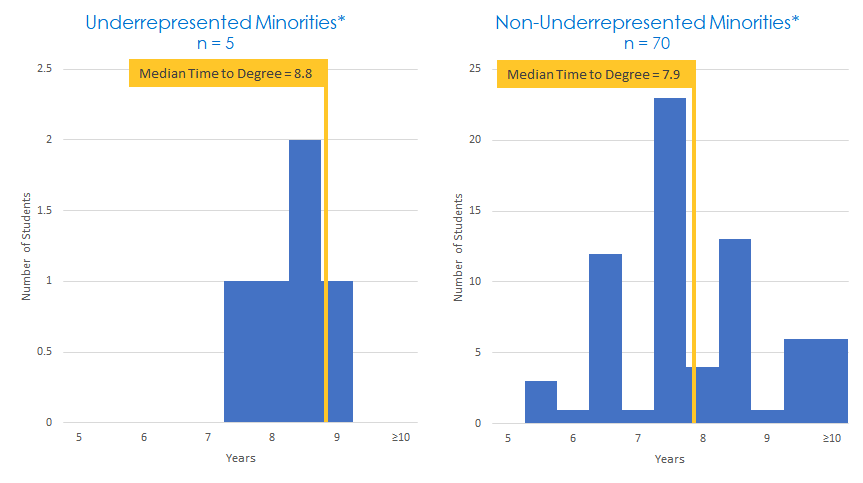
*International students are excluded from the URM data. US Citizens and Permanent Residents only.