

Mark Schnitzer
Stanford University
Investigator of the Howard Hughes Medical Institute and a Professor at Stanford University with a joint appointment in the Departments of Biology and of Applied Physics. He is Co-Director of the Cracking the Neural Code (CNC) Program at Stanford University and a faculty member of the Neuroscience, Biophysics, and Molecular Imaging Programs in the Stanford School of Medicine. Dr. Schnitzer has longstanding interests in neural circuit dynamics and optical imaging, has co-founded two scientific startup companies, and served on the Advisory Committee for the NIH BRAIN Initiative.
https://pyramidal.stanford.edu/index.html
His laboratory has two major research efforts:
• Innovation and application of optical imaging technologies for visualizing large-scale neural ensemble dynamics in awake behaving mice and fruit flies.
• Imaging and mechanistic studies of the neural ensemble basis for learning and long-term memory in cortical and sub-cortical brain areas.
An amygdalar neural ensemble that encodes the unpleasantness of pain
Gregory Corder, Biafra Ahanonu, Benjamin F. Grewe, Dong Wang, Mark J. Schnitzer, Grégory Scherrer Science. 2019
doi: 10.1126/science.aap8586.
Gründemann J, Bitterman Y, Lu T, Krabbe S, Grewe BF, Schnitzer MJ, Lüthi A. (2019) Amygdala ensembles encode behavioral states. Science. 364(6437). pii: eaav8736.
Marshall JD, Li JZ, Zhang Y, Gong Y, St-Pierre F, Lin MZ, Schnitzer MJ. (2016) Cell-Type-Specific Optical Recording of Membrane Voltage Dynamics in Freely Moving Mice. Cell. 167(6):1650-62.
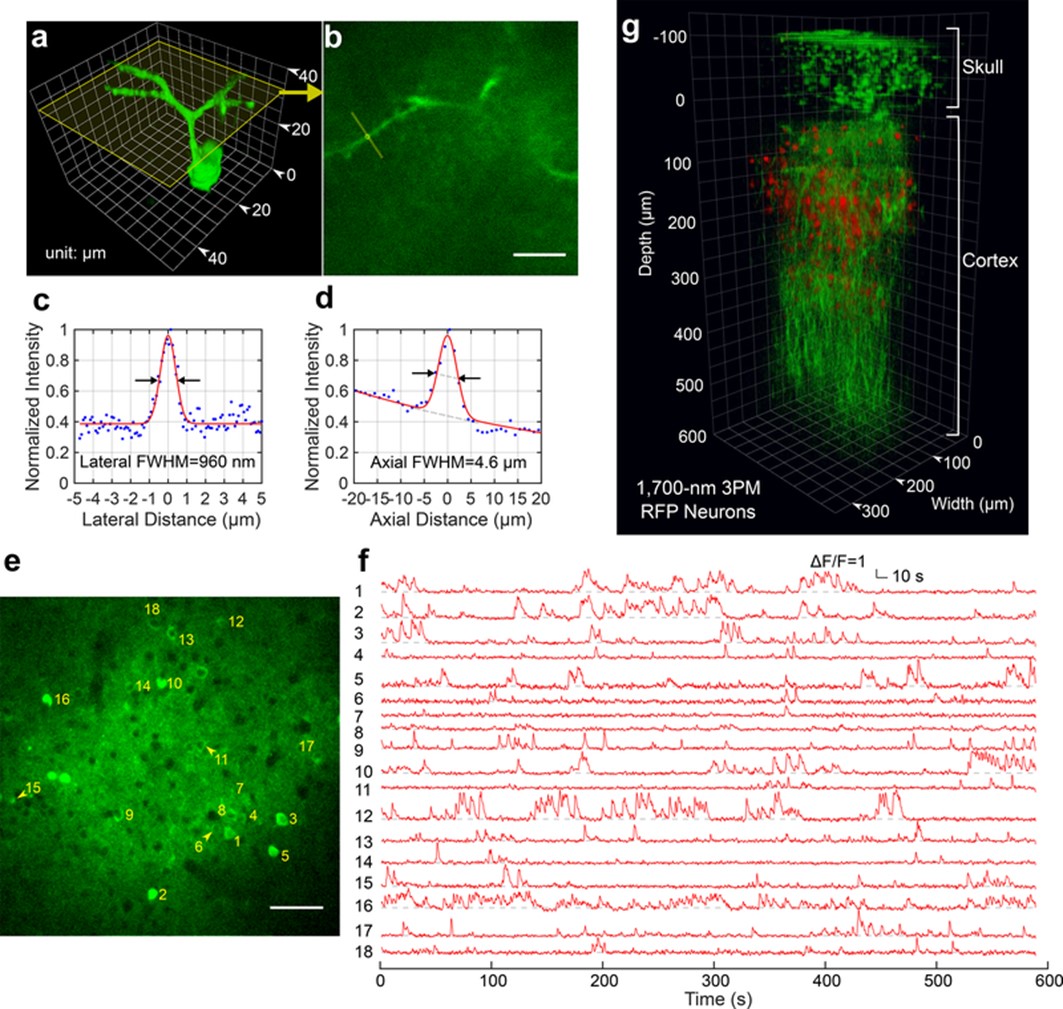
Fig from: Nat Methods. 2018 Oct; 15(10): 789–792. doi: 10.1038/s41592-018-0115-y
Fig. 2: a, 3D reconstruction of a GCaMP6s-labeled neuron located about 140 μm below the cortical surface in a transgenic mouse imaged by 1,320-nm 3PM through an intact skull of ~100-μm thickenss (CamKII-tTA/tetO-GCaMP6s mouse, 10 weeks old; similar measurements were performed on 3 neurons in each of 2 mice, for a total n = 6). b, A cross-section of the 3D stack along the yellow frame in a. Measurements for lateral and axial resolution on the apical dendrite were taken at the locations indicated by the yellow line and circle, respectively (similar results for n = 6). Scale bar, 10 μm. c, Lateral intensity profile measured along the yellow line in b, fitted by a Gaussian profile for the estimation of the lateral resolution (similar results for n = 6). d, Axial intensity profile measured in the region within the yellow circle in b, fitted by the sum of two Gaussian profiles, with one broad, off-centered Gaussian profile to correct for the uneven baseline, and the other for the central peak (similar results for n = 6). e, High-resolution image of a site for through-skull activity recording in an awake, GCaMP6s-labeled transgenic mouse (CamKII-tTA/tetO-GCaMP6s, female, 8 weeks old; similar results for n = 5). The recording site was about 275 μm below the cortical surface, and the FOV was 320 μm × 320 μm (256 × 256 pixels per frame). Scale bar, 50 μm. f, Spontaneous activity traces recorded under awake conditions from the indexed neurons in e, acquired at a frame rate of 8.49 Hz (similar results for n = 5). The repetition rate used for imaging was 800 kHz, and the average power under the objective lens was 44 mW. Each trace was normalized to its baseline and low-pass filtered by a hamming window of 1.06-s time constant. The same site was visited eight times over a period of 4 weeks after the skull preparation, with a cumulative total of over 6 h of recording time (data from other imaging sessions are shown in Supplementary Fig. 5). g, 3D reconstruction of through-skull imaging of a cortical column of red fluorescent protein (RFP)-labeled neurons in a Brainbow mouse (B6.Cg-Tg(Thy1-Brainbow1.0)HLich/J, male, 12 weeks old; similar results for n = 2). The red channel is the 3PE fluorescent signal from RFP, and the green channel is THG. The zero depth is set just beneath the skull.