Search Close Search
Page Menu

Postdoctoral Demographics

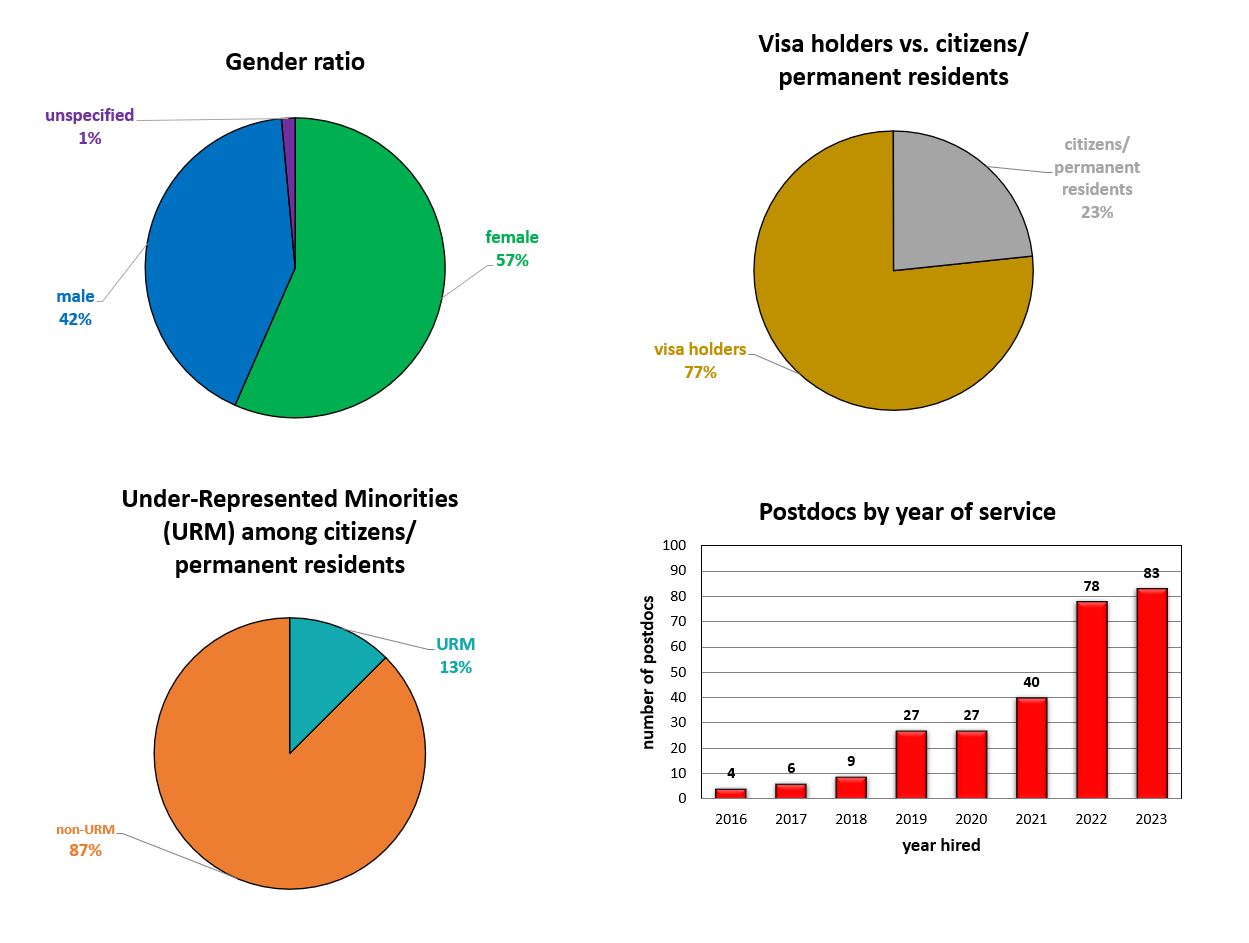
Previous Postdoctoral Demographics by Year:   2023 | 2022 | 2021 | 2020 | 2019 | 2018   
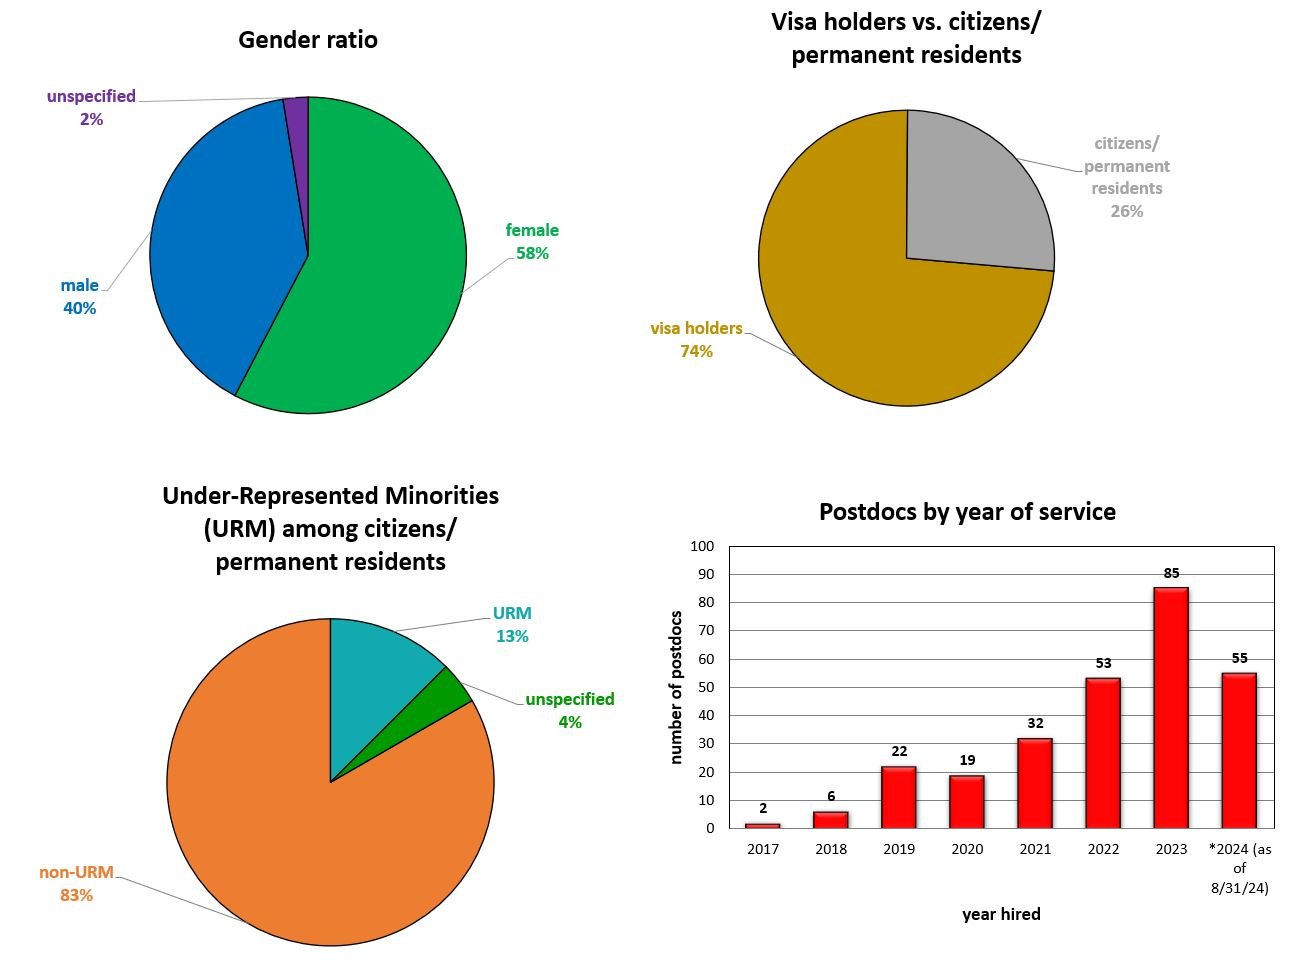
Current 2024

A set of four charts showing demographic and service‑year information about a postdoctoral population.   Gender ratio pie chart: – Female: 58% (largest segment, green) – Male: 40% (blue) – Unspecified: 2% (purple)   Visa holders vs. citizens/permanent residents pie chart: – Visa holders: 74% (gold, large majority) – Citizens/permanent residents: 26% (gray)   Under‑represented minorities (URM) among citizens/permanent residents pie chart: – Non‑URM: 83% (orange, largest segment) – URM: 13% (teal) – Unspecified: 4% (green)   Bar chart: Postdocs by year of service (year hired): Years shown from 2017 to 2024. – 2017: 2 – 2018: 6 – 2019: 22 – 2020: 19 – 2021: 32 – 2022: 53 – 2023: 85 – 2024 (as of 8/31/24): 55 Bars increase over time, peaking in 2023.